European print production 2021 – Chart of the week

Starting into the new year is a good time to have a look at the European print production developments in 2021. For the full revenue data to trickle in we have to wait several months – even for the first countries to report. The full data on Eurostat might be even two years out as Eurostat just about managed to publish 2019 revenues now.

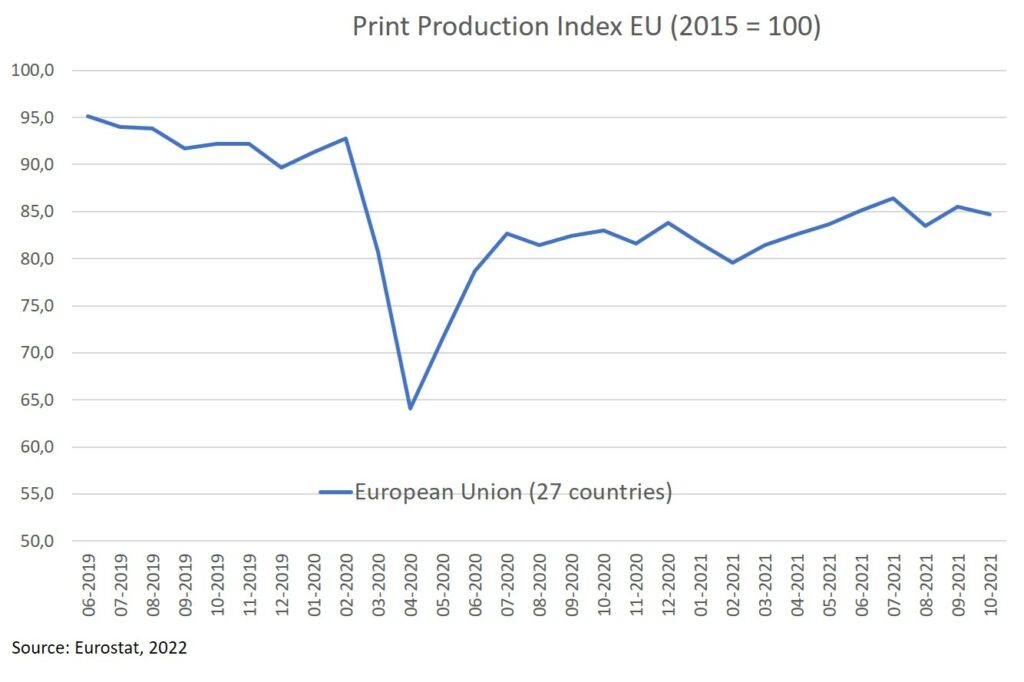
The next best thing is to look at the monthly production index data published by Eurostat. Data is now available until October 2021. The best fitting category in the database is “print and reproduction of media” – with print production making up the lions share in that category. The data is based on the average 2015 volumes as being 100 index points. Starting values in the 90s for 2019 shows that print production volumes already declined before the pandemic hit in early 2020.
Print production index data

Is print getting its fair share in advertising?

Ever wondered why advertising spending in print publications declined so rapidly and how much further this could go on? Or when is print getting its fair share in advertising? Interesting research from WARC/GWI compares advertising spend against media consumption. An index value above 100 shows that the advertising spending share is higher than the media consumption share, while a value below 100 indicates the opposite. In other words: print press had an advertising share three times its share of media consumption in 2013.

Newsbrands more memorable than Facebook – chart of the week

Some Facebook posts might stay in your mind but how about the ads found next to them? Are newsbrands more memorable than Facebook or vice versa?

Australian ThinkNewsBrands wanted to find out and commissioned the audience research lab MediaScience to get details on how recall, brand recognition and brand image compare in newspaper versus electronic media. The study included more than 5,350 participants and ran across 42 print runs and 252 websites which together created 6,037 unique brand exposures.

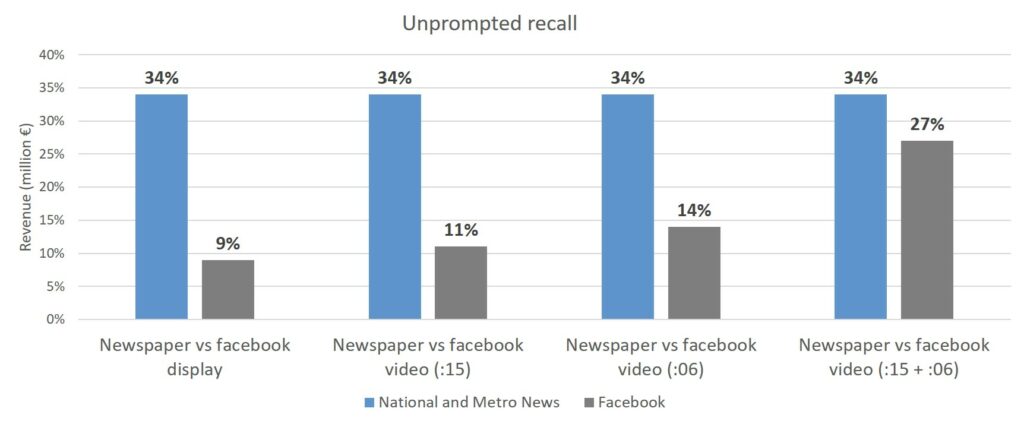
According to the findings, ads in printed newspapers outperform Facebook ads of all types by up to four times. When looking at printed ads, including quarter, half and full-page ads, compared with display, 6, or 15-second Facebook ads, news offers a superior level of unprompted recall.

Recall newsbrand ad vs Facebook

Reading printed books is good for you – and your grades – Chart of the week

In the light of distance learning during the pandemic and the move towards digital media in schools there is probably not enough of a discussion on how reading printed books is impacting learning, the joy of reading and consequently the grades. The OECD in sifting through the 2018 PISA study results on school performance published their “21st-Century Readers” report this year, with some interesting findings.

Average time spent reading e-mails – chart of the week

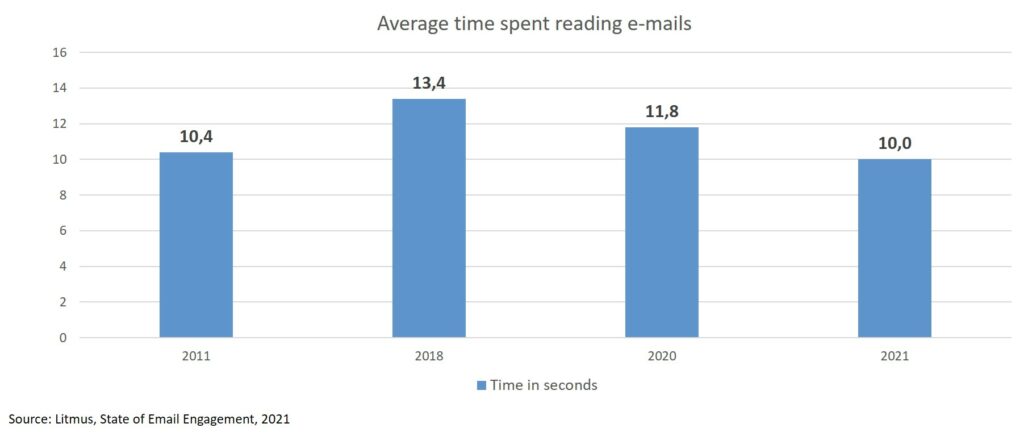
If you sent out e-mails you better come up with something to be read quickly. Litmus, describing itself as a leader in email marketing and analytics, published a report titled “State of Email Engagement” in which the average time spent reading an e-mail is only 10 seconds. This is down by 15% compared to the year before. In contrast to 2018 it is even 25% less time.

Average time spent reading e-mails