European print production 2021 – Chart of the week
Starting into the new year is a good time to have a look at the European print production developments in 2021. For the full revenue data to trickle in we have to wait several months – even for the first countries to report. The full data on Eurostat might be even two years out as Eurostat just about managed to publish 2019 revenues now.
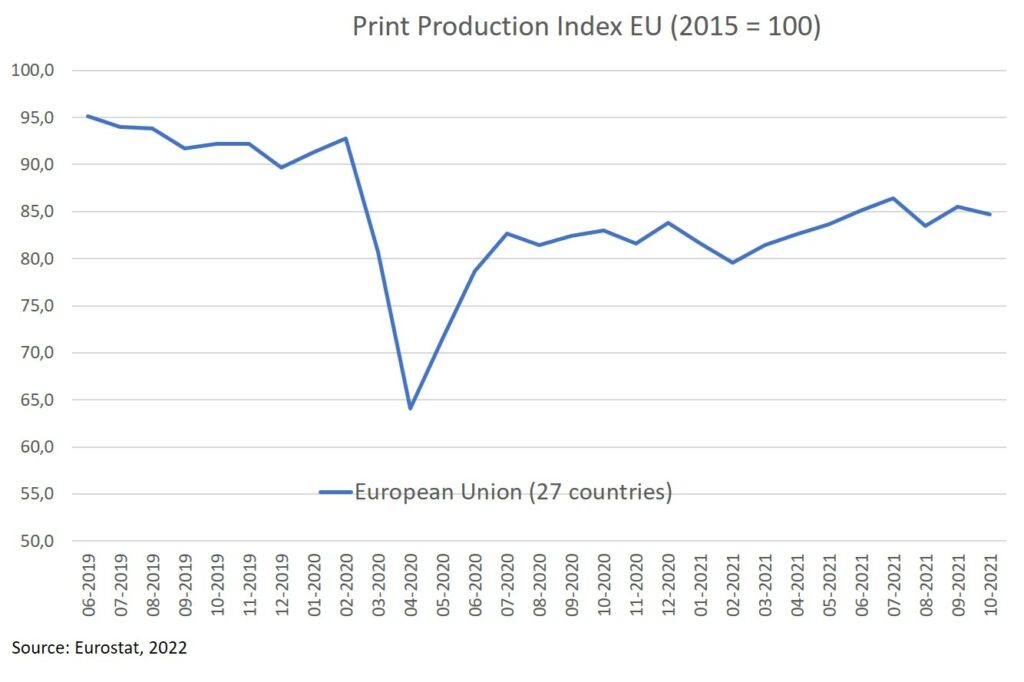
The next best thing is to look at the monthly production index data published by Eurostat. Data is now available until October 2021. The best fitting category in the database is “print and reproduction of media” – with print production making up the lions share in that category. The data is based on the average 2015 volumes as being 100 index points. Starting values in the 90s for 2019 shows that print production volumes already declined before the pandemic hit in early 2020.


