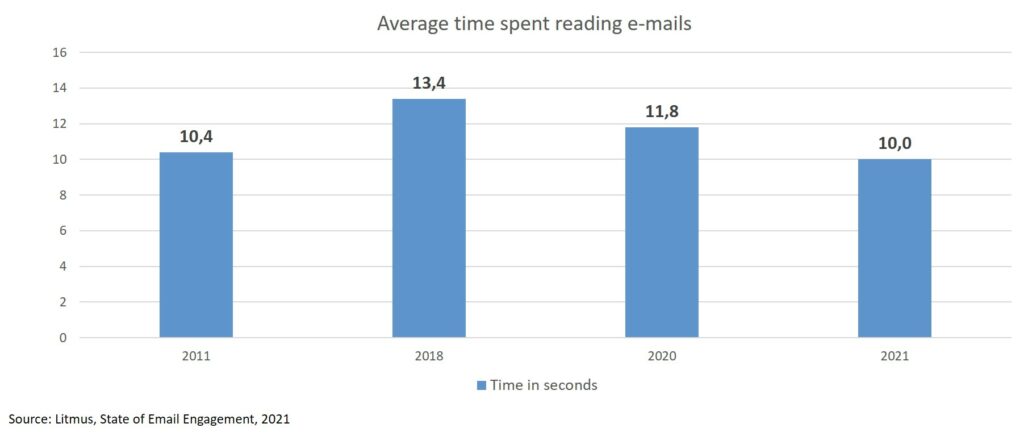
Average time spent reading e-mails – chart of the week

If you sent out e-mails you better come up with something to be read quickly. Litmus, describing itself as a leader in email marketing and analytics, published a report titled “State of Email Engagement” in which the average time spent reading an e-mail is only 10 seconds. This is down by 15% compared to the year before. In contrast to 2018 it is even 25% less time.

Average time spent reading e-mails

Marketing budget allocation – chart of the week

In an outside view marketing often equals advertising. Corporations need to perform a lot more activities within marketing however, which are necessary to plan and support advertising or are spent on other activities. This is reflected in the marketing budget allocation shares of the total spend according to a new study from salesforce.com. Only 22% of the total marketing budgets is allocated to advertising. Considerable shares are invested into technology and people – which includes salary, training and other personnel costs. Event and sponsorship rank high on the budget list as well, demonstrating how companies still spend considerable amounts on shows, events and sponsorship activities (which in turn might support events as well).

Share of Marketing budget allocation B2C

Recovered paper prices – chart of the week

If something is illustrating the current shortage in paper it is the rising costs of recovered paper. The chart shows German recovered paper prices – indexed for 2015 as 100%. China, once the main destination of recovered paper closed their borders for most waste materials in 2018 – which includes most recovered paper. This sent recovered paper prices into a tailspin. The bottom was reached during the first wave of the pandemic in 2020, when everything came to a standstill, at about 20% of the 2015 prices.

Recovered paper prices – chart of the week
Recovered paper prices Germany 2018 – 2021

Door drops are dropping – Chart of the week

In many European countries door drops are a huge alternative to addressed direct mail. The DMA just published their 2021 Annual Door Drop Industry Report for the UK. It might not be a huge surprise that door drop volumes and revenues were dropping in 2020 – after all the pandemic forced many businesses to restrict activity and scale down marketing. Yet a 33.6% drop for 2020 is quite drastic.

UK door drop volumes
UK door drop volumes 2016 to 2020

Chart of the week: How print applications fared in 2020

After a lot of speculation, finally the first sets of (real) numbers are out on how different print applications fared in 2020. The German printing industry association (BVDM) just published their 2020 print industry stats. The faint hearted should be warned – it is no pretty picture, however not unexpected.

How print applications fared in 2020 versus 2019
2020 vs 2019 revenue by application – Germany

Overall print revenues declined by 11.5% to €10.8 bn. This is somewhat in the expected range. There are some interesting details in the distribution, however.