All The News That’s Fit To Change

In a world that is moving to electronic media, one of the biggest strongholds of printed news is its credibility. Even in a media wary environment this is being confirmed again and again. Should a newspaper not rather bank on that trust than undermine it? If the online edition of a renowned newspaper changes their headlines to get more views, is this already clickbaiting? 

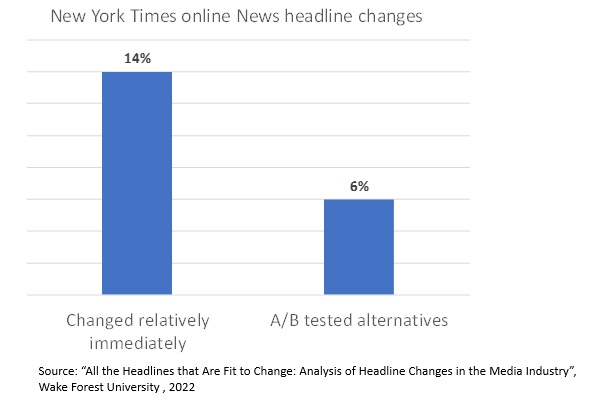
In their study “All the Headlines that Are Fit to Change: Analysis of Headline Changes in the Media Industry” researchers at Wake Forest University found that The New York Times regularly changes the headlines of their online articles. During the period observed in 2021 about 14% of all headlines were changed relatively immediately after they were published. Another 6% were subject to A/B testing, in which different readers were shown differing headlines.
Print Magazine launches doubling – chart of the week

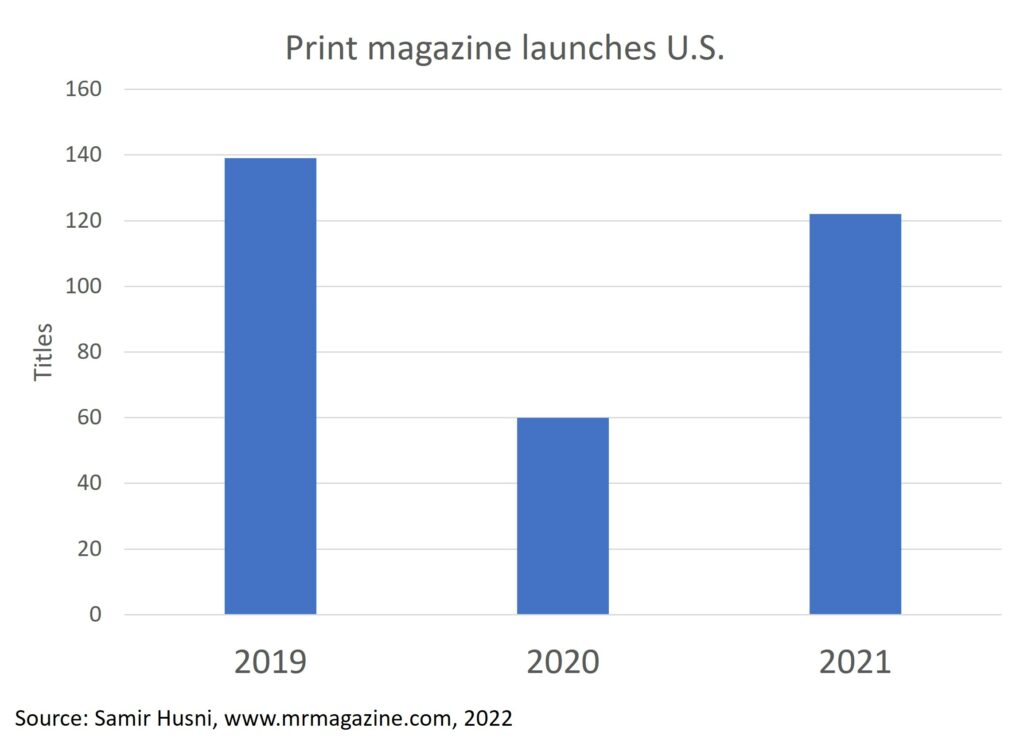
The pandemic did show us many processes moving digital. Communication is no exception. There is a huge push to move books to digital, although there are grave disadvantages. Magazine has been a bit under the radar and the declines in circulation in many countries are known. The better to see that launches of print magazines rebounded after the pandemic slump in 2020. According to Mr Magazine, Samir Husni, U.S. print Magazine launches were doubling in 2021 compared to 2020.

US print magazine launches 2019 - 2021

How cryptocurrencies and NFTs ruin our climate

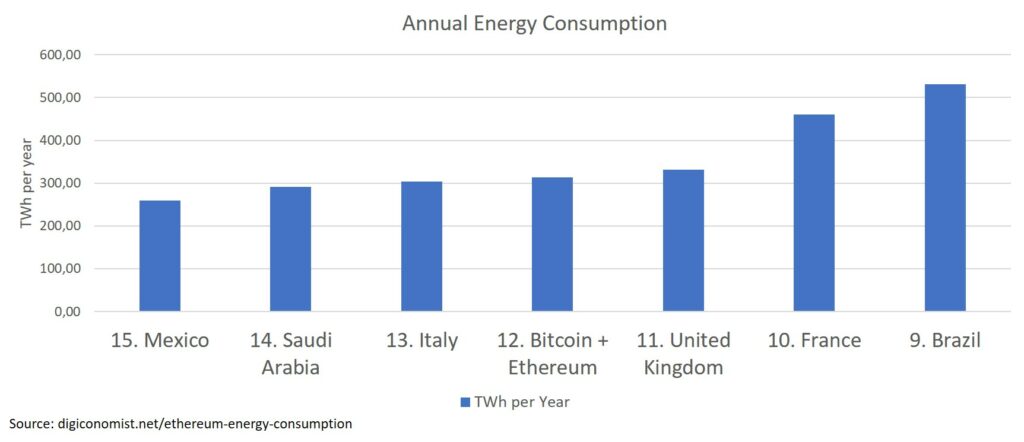
The last time (a few years ago) I heard about the energy consumption of Bitcoin mining it was tipped to use an energy equivalent in the range of Ireland to Austria. That was bad enough but I did not expect how cryptocurrencies and NFTs ruin our climate today. Now I stumbled across the latest statistics that the energy of the two biggest cryptocurrencies, Bitcoin and Ethereum, have an energy consumption ranging between Italy and the UK!

         Energy Consumption by Country including Bitcoin & Ethereum

In other words, a single Bitcoin transaction uses up as much energy an average US household would over 73,82 days! Or it would equate to 1,451,245 VISA transactions!

Popular in the pandemic – Google searches analysed

What analysts and marketers like about the internet is that everything is measurable – as pointless as it may be in many cases. Yet there is a bunch of internet stats that are helpful or at least entertaining. The latter is in my view a website that analysed Google searches and looked at how popular product search terms were in the pandemic.

For the printing industry most categories are of limited interest as mostly consumer goods made it to the searched item roster. Keywords and categories were sourced from Google product taxonomy. Results are restricted to searches on Google Shopping in the US only. The analysis ranked products and their search terms into three groups.

European print production 2021 – Chart of the week

Starting into the new year is a good time to have a look at the European print production developments in 2021. For the full revenue data to trickle in we have to wait several months – even for the first countries to report. The full data on Eurostat might be even two years out as Eurostat just about managed to publish 2019 revenues now.

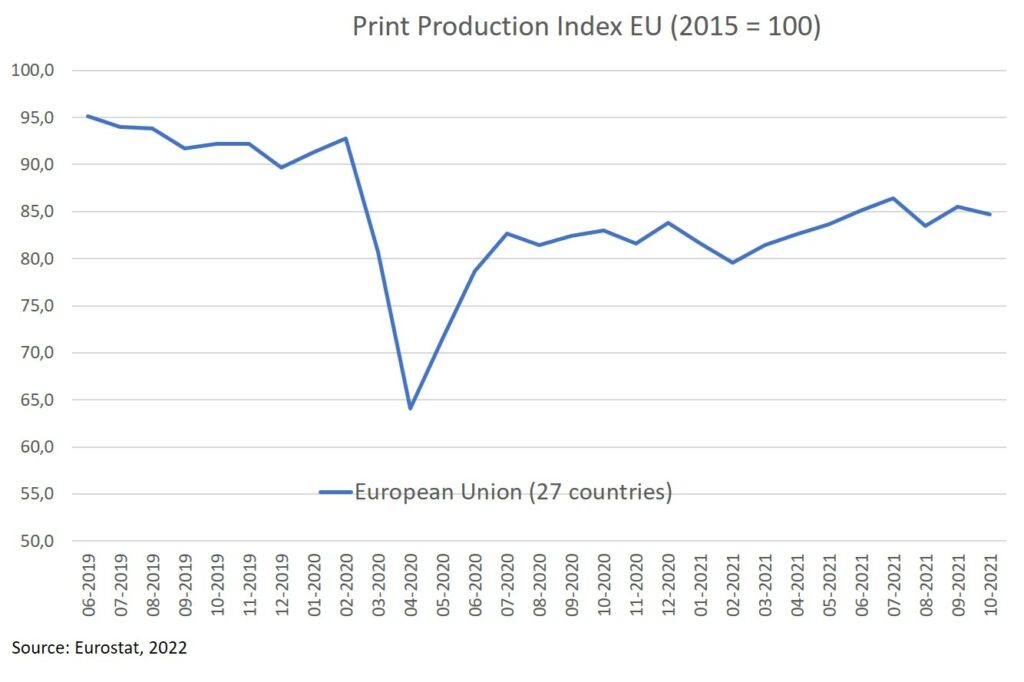
The next best thing is to look at the monthly production index data published by Eurostat. Data is now available until October 2021. The best fitting category in the database is “print and reproduction of media” – with print production making up the lions share in that category. The data is based on the average 2015 volumes as being 100 index points. Starting values in the 90s for 2019 shows that print production volumes already declined before the pandemic hit in early 2020.

Print production index data